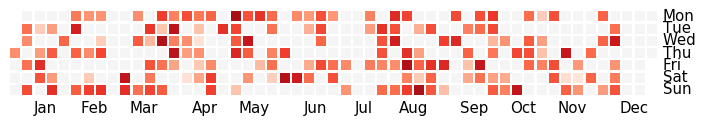
Plot Pandas time series data sampled by day in a heatmap per calendar year, similar to GitHub's contributions plot, using matplotlib.
See the documentation.
To install the latest release via PyPI using pip:
pip install calmap
| Name | Name | Last commit date | ||
|---|---|---|---|---|
Plot Pandas time series data sampled by day in a heatmap per calendar year, similar to GitHub's contributions plot, using matplotlib.
See the documentation.
To install the latest release via PyPI using pip:
pip install calmap