Add storage path size prometheus gauge#3768
Merged
Merged
Conversation
jonaylor89
approved these changes
Aug 26, 2022
 jonaylor89
left a comment
jonaylor89
left a comment
Contributor
There was a problem hiding this comment.
I don't have a ton of context on the health check stuff but all the prometheus stuff looks right. I played around with the health check portion and it seems to make sense.
Since it works locally and it a relatively small PR - LGTM
SidSethi
reviewed
Aug 26, 2022
 SidSethi
left a comment
SidSethi
left a comment
Contributor
There was a problem hiding this comment.
this should def be recorded from inside monitors queue instead of on every health check, but should be fine for now
Merged
This file contains hidden or bidirectional Unicode text that may be interpreted or compiled differently than what appears below. To review, open the file in an editor that reveals hidden Unicode characters.
Learn more about bidirectional Unicode characters
Sign up for free
to join this conversation on GitHub.
Already have an account?
Sign in to comment
3 participants
Add this suggestion to a batch that can be applied as a single commit.This suggestion is invalid because no changes were made to the code.Suggestions cannot be applied while the pull request is closed.Suggestions cannot be applied while viewing a subset of changes.Only one suggestion per line can be applied in a batch.Add this suggestion to a batch that can be applied as a single commit.Applying suggestions on deleted lines is not supported.You must change the existing code in this line in order to create a valid suggestion.Outdated suggestions cannot be applied.This suggestion has been applied or marked resolved.Suggestions cannot be applied from pending reviews.Suggestions cannot be applied on multi-line comments.Suggestions cannot be applied while the pull request is queued to merge.Suggestion cannot be applied right now. Please check back later.
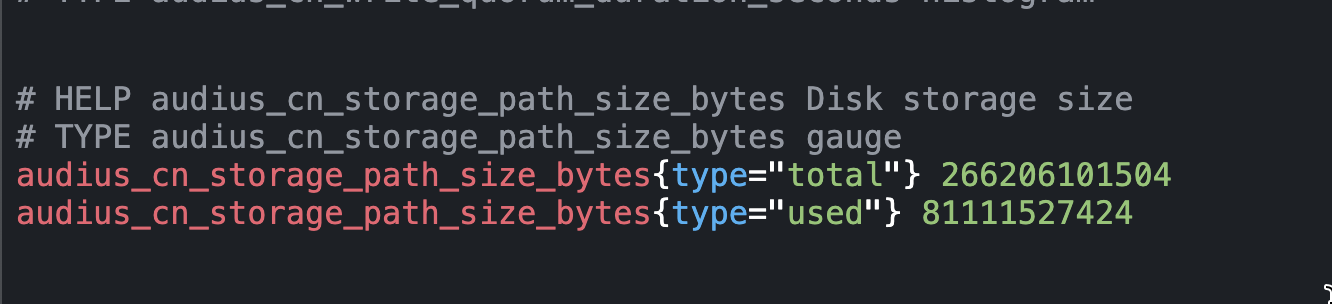
Description
Add a storage size metric in Prometheus. This will allow us to graph % utilized disk across all content nodes and find out how much storage capacity we've used network wide.
Tests
Tested locally and verified that metric shows up correctly in prometheus_metrics endpoint
Monitoring - How will this change be monitored? Are there sufficient logs / alerts?
Will add a grafana panel and alert on stage/prod